Last Updated on 18 Aug 2025
Mining Cybersecurity And Fraud Hierarchy: A Practical Guide For OT, IT, And Mine Operations
Share in
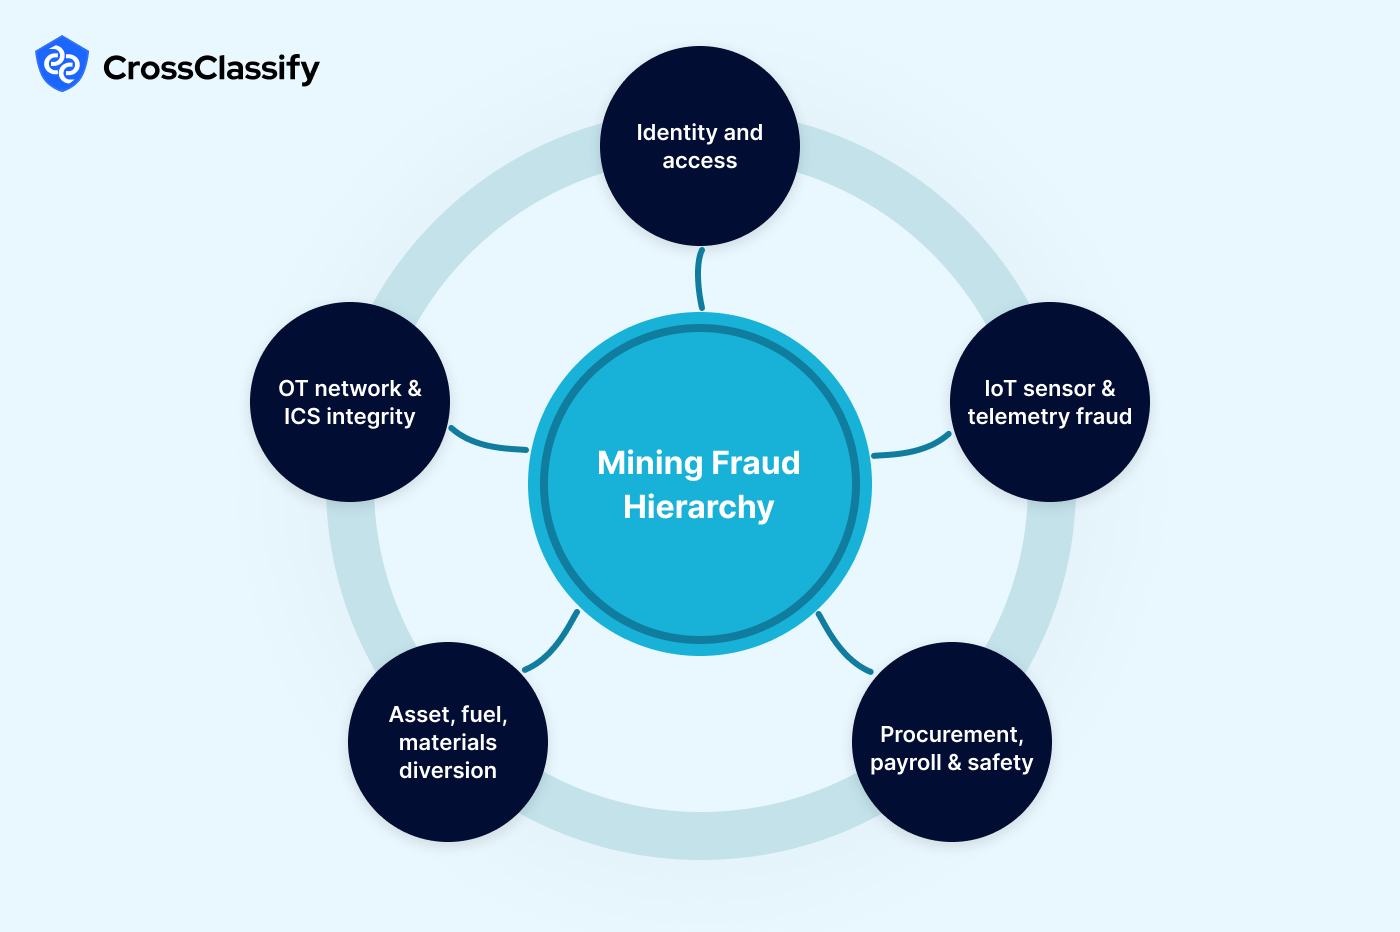
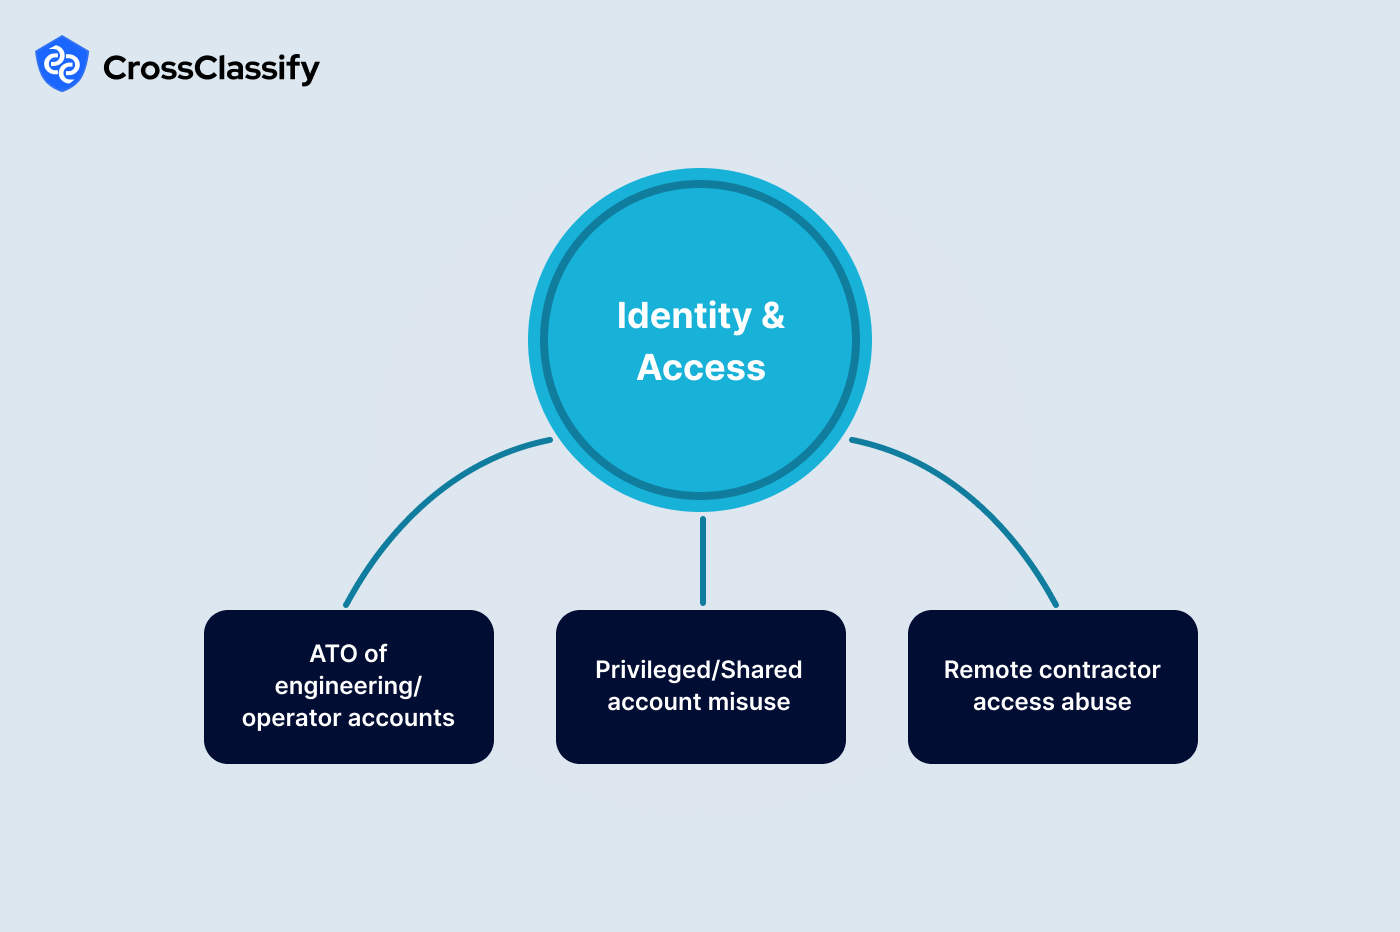
Identity and Access Threats in Mining OT and IT
Mining environments blend enterprise IT with on-site operational technology. Attackers target engineer and operator identities because a single successful login can reach historians, PLC configuration tools, or dispatch consoles. A disciplined program starts with device intelligence, behavioral analytics, and adaptive challenges that trigger only when risk spikes, preserving shift productivity.
Contractor access multiplies risk because many vendors bring their own laptops, remote tools, and VPNs, which can mask compromised devices. Real incidents in heavy industry show the blast radius when identity controls fail and operations must be slowed or put into manual mode. The Norsk Hydro case in 2019 is widely cited because ransomware entered through a phished identity and forced parts of the aluminum producer to switch to manual operations while incurring tens of millions of dollars in losses . Source: Nozomi Networks
Contractor access multiplies risk because many vendors bring their own laptops, remote tools, and VPNs, which can mask compromised devices. Real incidents in heavy industry show the blast radius when identity controls fail and operations must be slowed or put into manual mode. The Norsk Hydro case in 2019 is widely cited because ransomware entered through a phished identity and forced parts of the aluminum producer to switch to manual operations while incurring tens of millions of dollars in losses . Source: Nozomi Networks
1. Account takeover of engineering and operator accounts
Account takeover in a mine environment usually starts with credential reuse or phishing, followed by logins from new devices or geographies just before privileged actions. The pattern often includes a brief storm of failed logins that is immediately followed by a success, which is the typical signature of credential stuffing. High-risk sessions then modify contact details, rotate API tokens, or reach tools that can change process set-points. In a mixed IT and OT environment, even short windows of privilege can alter production or safety envelopes. The Norsk Hydro response after LockerGoga shows why identity hardening must be continuous, not only at login, because operations can be forced into manual workarounds when attackers gain a foothold .
Signals and evidence:•
New login at an unusual site and hour before a privileged change: Heatmap diagram of logins by site and hour helps you see whether access aligns to shifts and sites. Legitimate operators cluster around their home site and scheduled hours. Hotspots at off hours or new locations just before configuration activity are takeover red flags.•
Failures then a success in the same window: A line graph that plots failed and successful logins over time reveals rebound patterns. Stable failure baselines suggest healthy authentication. Failure spikes followed by a success in the same window indicate a likely takeover.
2. Privileged and shared account misuse
Many mines still rely on shared admin credentials for legacy systems or for quick maintenance access, which obscures accountability. Misuse presents as privilege escalations that occur outside approved change windows or as one admin password touching a surprising number of endpoints. These behaviors are dangerous in plants that run with tight operational limits because small unauthorized changes can cascade into downtime. Building a device-to-endpoint graph and enforcing least privilege sharply reduces this class of risk. Teams that shift to named accounts with step-up verification during sensitive changes materially improve both auditability and resilience.
Signals and evidence:•
Escalations outside change windows: A line dashboard that overlays escalation events against the planned maintenance band shows whether work is controlled or opportunistic. Good environments concentrate events inside the grey band. Clusters outside the band deserve investigation.•
One credential used on many hosts: A bar graph of endpoints per credential should be low and flat in a hardened environment. Tall bars indicate shared passwords or credentials that have leaked onto jump boxes.
3. Contractor and third-party access risks
Large mines depend on OEMs, surveyors, drone operators, and software suppliers who connect remotely or on site. A single compromised partner endpoint can become a beachhead into both business and plant networks. Practical warning signs include VPN sessions that originate from new networks, unusual session timing that lines up with configuration pushes, and contractors touching multiple sites in one shift. The risk is not hypothetical. Rio Tinto disclosed in 2023 that personal data had been exposed via a third-party file transfer product , which is a reminder that vendor tools can be the entry point into sensitive systems. ReutersMine
Signals and evidence:•
New ASN or network before configuration activity: A comparative line dashboard of sessions from known networks and sessions from new networks makes spikes obvious. New networks should be rare and vetted. Spikes just before changes are a high-value triage cue.•
One contractor touching many sites per shift: A bar graph of sites per contractor should show ones and twos. Outliers mean roaming credentials or account sharing that defeat containment.
OT Network and ICS Integrity in Mines
OT networks run crushers, mills, conveyors, thickeners, and paste plants. Unauthorized commands or protocol misuse can destabilize processes, interrupt safety systems, or misreport key performance variables. Defenders need command-mix baselines by asset and shift, attention to protocol ports, and polling rates by node so that anomalies stand out. A capability to correlate control commands with production throughput is crucial because unsafe actions often happen during active production rather than scheduled maintenance. Real-world metals and logistics incidents show that even when production continues, companies may need to disconnect systems and fall back to manual procedures to manage risk. Aurubis, a major copper producer, reported a cyberattack in 2022 that led to preventive shutdowns of IT systems across sites while the wider metals and mining sector was being targeted . Reutersaurubis.com
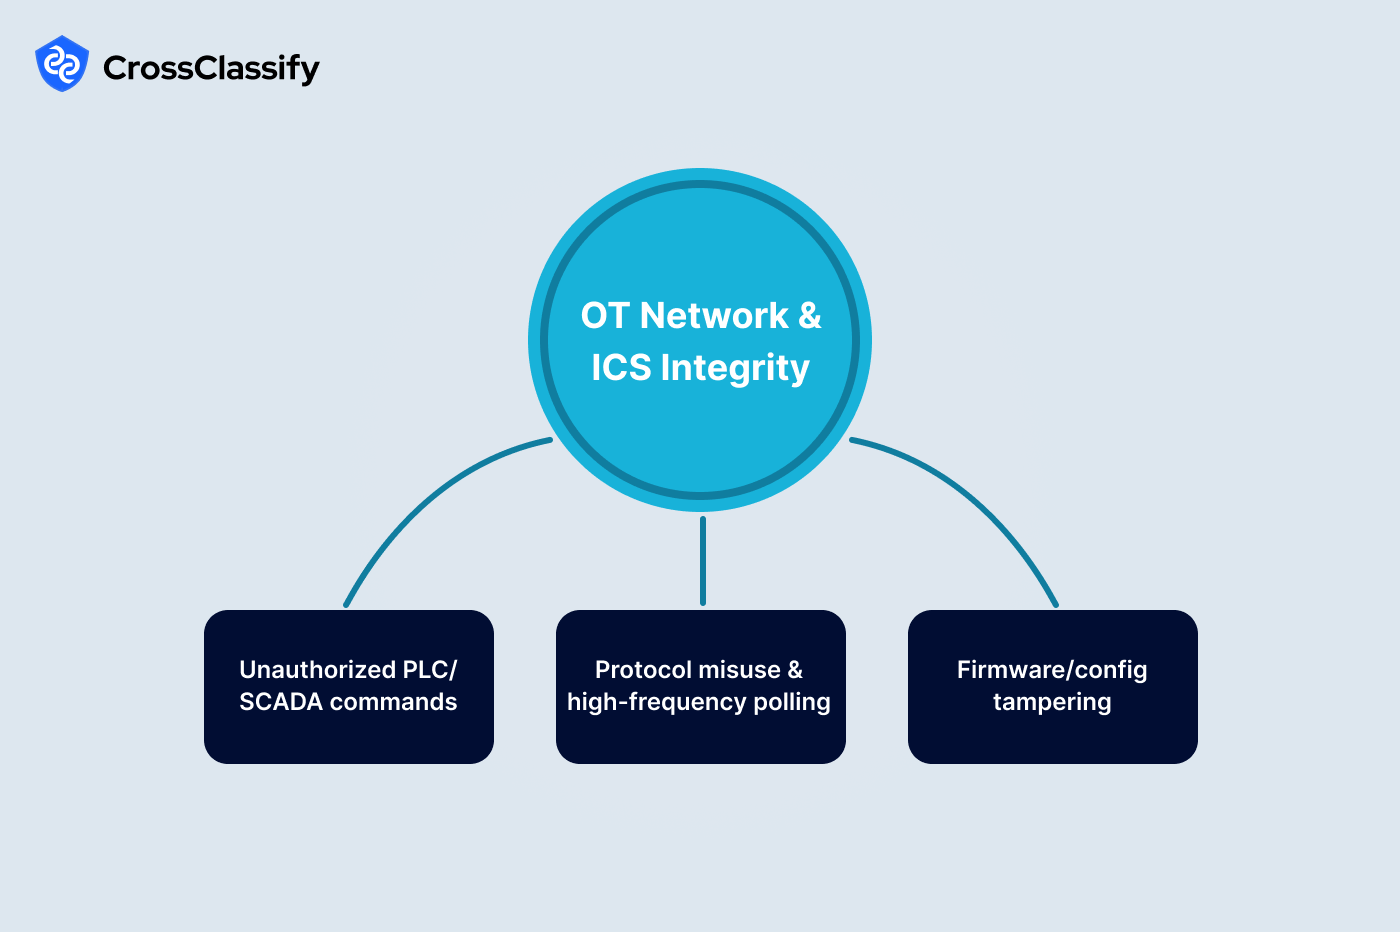
1. Unauthorized PLC or SCADA commands
Production environments are read-heavy. Large rises in WriteCoil, WriteRegister, Run, or Stop commands often point to tampering, test code left enabled, or malware. The riskiest pattern is a Stop or mode change while production is active, because it can cause conveyor surges, pump trips, or wear from repeated starts. Your best defense is to keep a clean baseline per asset and to alert when the command mix departs from historical ratios. Incidents in critical infrastructure, such as the Colonial Pipeline ransomware shutdown, illustrate how quickly command and control outages can escalate into real supply chain impact even when the underlying equipment is intact . AxiosCISA
Signals and evidence:•
Write and Stop count anomalies: A bar dashboard of command types makes an unhealthy mix visible in seconds. In a mill or flotation circuit, read calls should dominate. Raised write or stop bars deserve immediate review.•
Run and Stop during peak production: A line graph that overlays throughput with control events shows whether unsafe commands appear inside active windows. Legitimate changes belong in maintenance windows, not during a time-on-ore period.
2. Protocol misuse and high-frequency polling
Protocol discipline matters because covert channels make it harder to reason about risk. When a single node polls at much higher frequency than its peers, it can be a misconfigured historian or a malicious scraper. Protocols that appear on non-standard ports defeat allowlists and are often a sign of shadow systems. Mining teams should inventory ports and expected client and server roles so that deviations create immediate alerts. Reducing noisy polling also improves controller stability and network reliability.
Signals and evidence:•
High-rate polling by one node: A five-minute line dashboard per node shows healthy parallelism among lines. A single series that rises well above the pack indicates misconfiguration or reconnaissance.•
Protocols on unexpected ports: A table listing timestamp, source, protocol, and destination port should map to known standards. Rows that show Modbus or OPC on wrong ports are high-priority tickets.
3. Firmware and configuration integrity
Tampered firmware and hidden configuration changes are long-lived risks because they survive reboots and operator turnover. A defensible posture requires golden images, cryptographic signatures, and change control that records digests before and after every upload. In practice many sites discover unsigned images and ad-hoc tweaks after an incident because monitoring was not continuous. The operational impact is often prolonged investigation and unnecessary downtime while devices are verified. Metals industry cases where companies disconnected systems across many sites after cyberattacks show why having signed images and clean change logs accelerates incident recovery. aurubis.com
Signals and evidence:•
Checksum or signature changes: A table with device, version, checksum before and after, and signature status lets responders triage quickly. Rows with changed digests or no signature should stop production changes until verified.•
Unsigned uploads by month: A bar dashboard that sits at zero is the goal. Visible bars mean your engineering workstations and policies allow risky payloads.
IoT Sensor and Telemetry Fraud in Mines
Sensors underpin maintenance, energy management, and compliance. Attackers and insiders can spoof or freeze readings to hide problems or to meet production or bonus targets. Cross-sensor comparisons and physics checks are powerful because they expose values that cannot be true together. GPS and telematics are attractive to manipulate because they drive fuel custody, utilization metrics, and safety compliance. Environmental telemetry must be treated as evidence because external regulators can demand defensible data, especially when readings approach legal thresholds.
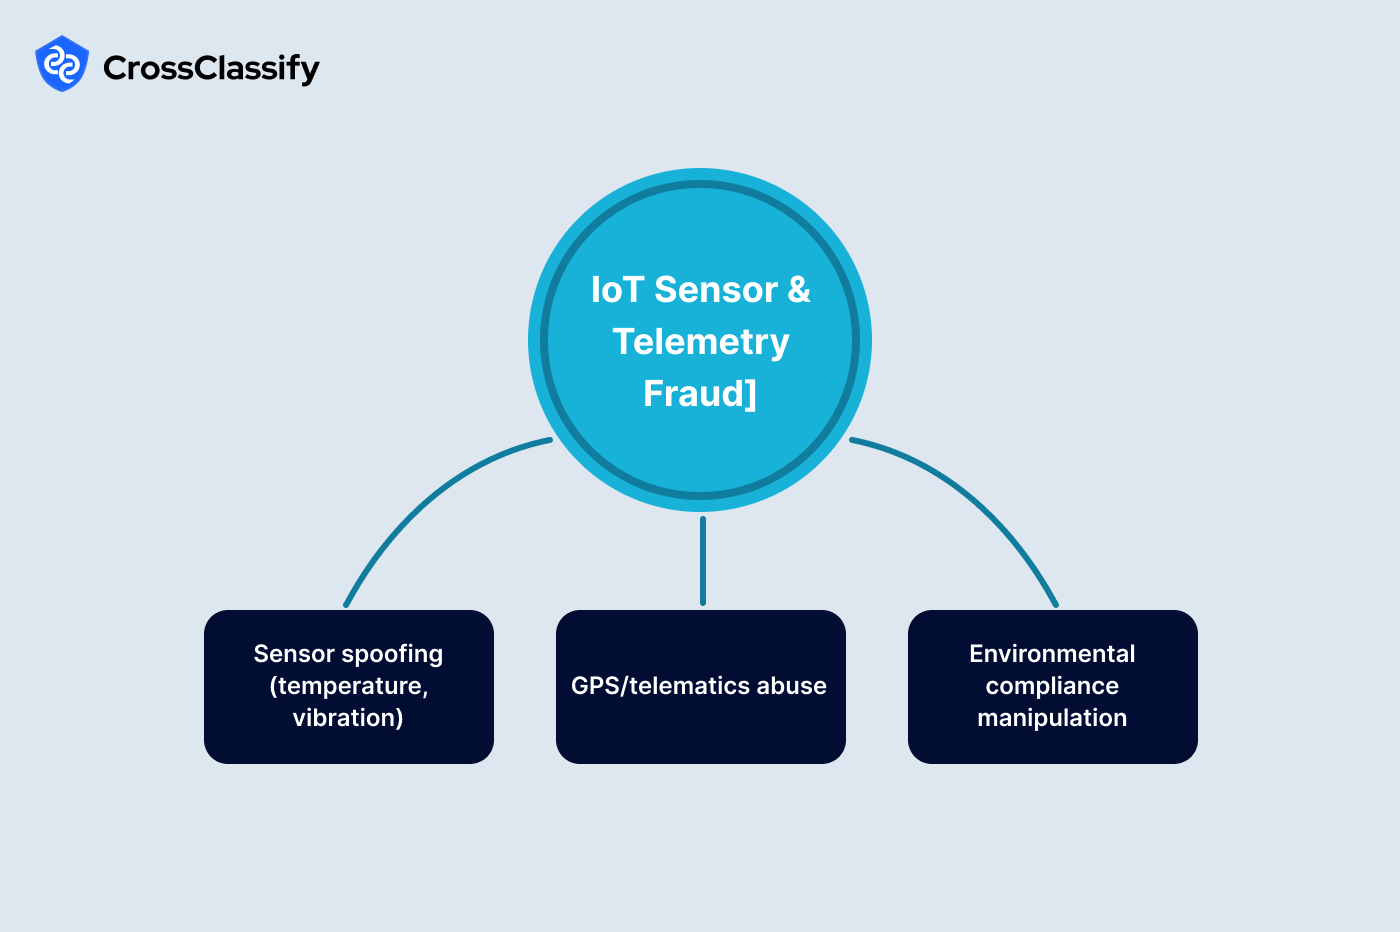
1. Physics-inconsistent process sensors
Bearings, sumps, and gearboxes emit thermal and vibration signatures that correlate with ambient conditions and load. A single sensor that spikes sharply while ambient is flat likely reflects spoofing or a failing probe. Frozen values are also suspicious during active operation because real systems wander even under steady load. These patterns are easy to see when you visualize ambient and target readings together with a rolling variance band. Plants that enforce automatic fail-safe states on implausible readings avoid expensive secondary damage.
Signals and evidence:•
Divergence from ambient: A line graph that plots ambient and process readings should show parallel movement within tolerance. Sharp separation is a red flag that merits inspection.•
Flatline during operation: A rolling variance graph should never collapse to zero while equipment runs. Long flat spans indicate frozen values or bypassed sensors.
2. GPS and telematics abuse
Haul trucks and service vehicles generate location, speed, and engine hour data that drive dispatch and custody decisions. Speed readings far above policy limits or distances between pings that imply teleportation indicate tampering or device identity swapping. These anomalies also correlate with refueling outliers when siphoning or mis-coded fills are in play. Mines that couple GPS to refueling and gate events with device fingerprinting close the loop on both safety and asset protection. Broader critical-infrastructure events such as the Colonial Pipeline shutdown illustrate the ripple effects when fleet and fuel custody are compromised across a region , which is why mines treat telematics integrity as a governance issue, not just an engineering task. Axios
Signals and evidence:•
Speed over threshold: A line dashboard with the policy limit drawn as a reference makes spikes unambiguous. Persistent or extreme violations should trigger step-up checks or lockouts.•
Impossible distance between pings: A line graph of meters per interval should be smooth under normal conditions. Sharp jumps are strong evidence of GPS manipulation.
3. Environmental compliance data manipulation
When readings congregate just below a legal limit, it can indicate pressure to meet targets through data manipulation rather than process improvement. Edits that occur minutes after capture by the same users are particularly suspicious because real corrections usually involve investigation and documentation. Treat environmental telemetry like financial records with version history, signing, and dual control on any edit. Your objective is not only catching manipulation but also creating evidence that stands up during audits and disputes. Compliance incidents in other sectors, like the wave of data theft linked to the MOVEit exploitation, underline the need to secure the systems that store and transfer environmental data as well. CISA
Signals and evidence:•
Near-limit clustering: A histogram graph with the regulator limit drawn as a vertical line should show a natural bell shape around the operating mean. A pileup at the edge points to gaming or instrumentation bias.•
Rapid post-collection edits: A table that lists record id, metric, editor, and minutes since capture helps you spot unusual edit patterns. Frequent fast edits call for dual control and extra review.
Asset, Fuel, and Materials Diversion
Commodity volumes and fuel are high value and mobile, which attracts both opportunists and organized abuse. Fraud appears when fuel dispensed does not align with engine hours, when weighbridge in-minus-out deltas trend positive by shift or route, or when inventory adjustments concentrate around one user late at night. Grade manipulation is especially sensitive because it influences revenue share and royalties. The goal is to tie custody to device fingerprints and identities, then use outlier detection to find cases that do not fit operational physics or policy.
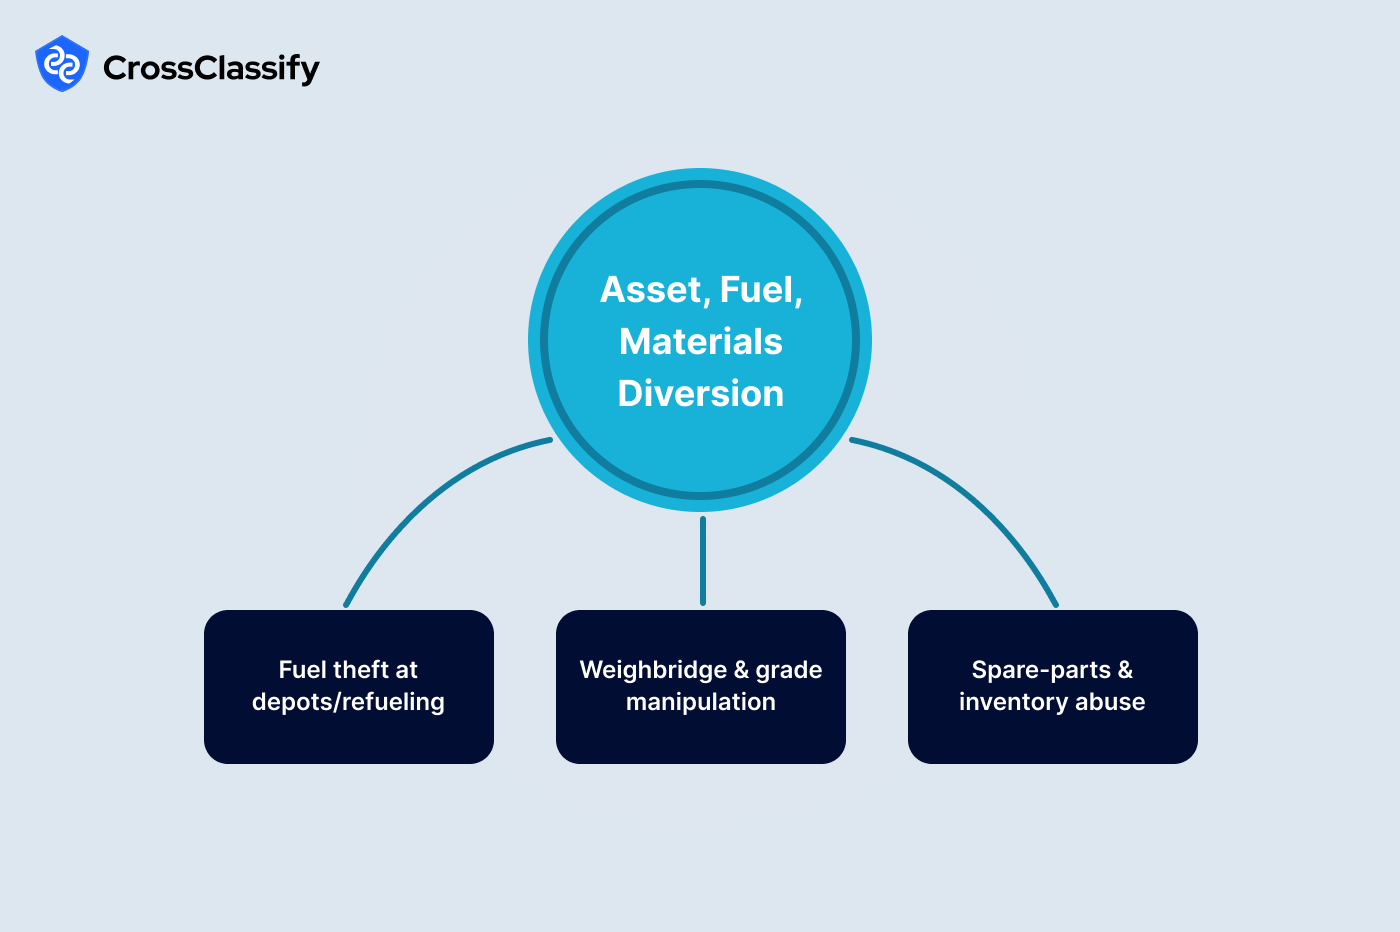
1. Fuel theft at depots or during mobile refueling
A clean signal of fraud is fuel volume that does not scale with engine hours for the same period. Another is an RFID that drives many more night refuels than peers, which often reflects siphoning under low supervision. When fuel events are linked to GPS, gate cameras, and device fingerprints, it becomes difficult for an attacker to fake a consistent story. You also gain evidence that supports recovery and discipline. Regional infrastructure incidents that disrupted fuel logistics show how fragile supply can be when attackers target energy custody, which is a reminder that on-site fuel governance matters even when your own systems are not directly attacked. The Guardian
Signals and evidence:•
Fuel vs engine hours outliers: A scatter graph should form a diagonal cloud. Points that sit high above the trend, especially with low hours, indicate diversion.•
Night refuel concentration on one RFID: A bar dashboard of refuels from midnight to early morning should be low and even. Outliers call for camera review and device checks.
2. Weighbridge and grade manipulation
In a well-tuned process, in-minus-out weight deltas wobble around a small tolerance. Sustained runs above tolerance by shift or by route may indicate manipulation or calibration drift. Grade distributions are similarly stable over weeks at a given pit blend and mill configuration. When a new low-grade tail grows, it can mean blending fraud or reporting bias. The metals sector has seen companies temporarily disconnect IT systems across sites after cyberattacks to limit damage, which shows why verification procedures and offline checks matter during investigations. aurubis.com
Signals and evidence:•
Delta spikes by window: A line graph of deltas over time highlights runs that exceed tolerance. Those windows should trigger targeted sample pulls.•
Grade tail growth: A histogram graph reveals new tails and helps quantify impact on revenue share.
3. Spare parts and inventory abuse
Late-night adjustments and concentrated returns around one user are two of the cleanest indicators of parts diversion. Most warehouses exhibit spread across users and hours that align to shifts. A single user who performs many adjustments outside normal hours deserves attention, particularly if they also lead in returns or write-offs. Link analysis that connects users to vehicles, jobs, and cost centers exposes the end-to-end story. Closing the loop with device fingerprints blocks account sharing that often hides the real actor.
Signals and evidence:•
Adjustments by user and hour: A heatmap diagram that compares users and hours reveals bright bands after hours. These bands are evidence for an audit.•
Return concentration: A bar dashboard where one user dominates returns or write-offs is a strong lead for investigation.
Procurement, Payroll, and Safety Integrity
Financial and workforce workflows are frequent fraud paths because they involve many actors and approvals. A classic tactic is to submit invoices clustered just below approval thresholds, which avoids scrutiny while keeping totals high. Another is to create shell vendors that reuse bank accounts, which you can reveal with a vendor-to-bank network. Timekeeping abuse surfaces as badge events with no geofence confirmation or as synchronized time patterns across many workers. Safety forms that arrive in a single burst just before shift end are also suspect because real inspections occur across time and location. South Africa's Transnet cyberattack in 2021 and the subsequent need to restore operations at container ports demonstrated that administrative systems can create large downstream operational effects across industrial supply chains , which is why procurement and workforce controls belong in the same risk program as OT.
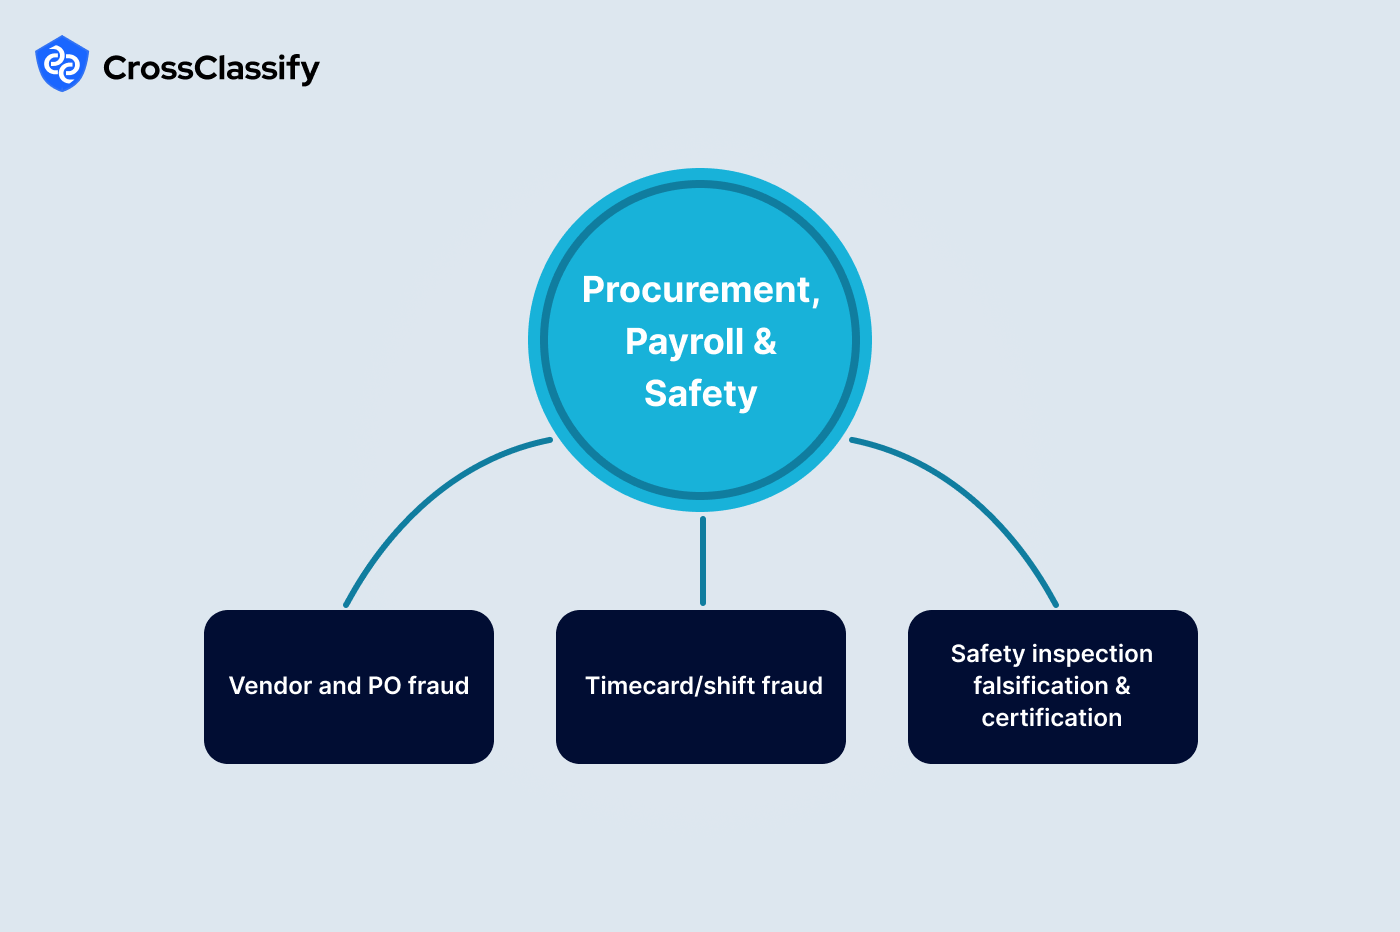
1. Vendor and purchase order fraud
Healthy invoice distributions do not cling to the edge of approval thresholds. When a vendor submits many invoices just below a limit, it often reflects split purchase orders or quota gaming. A second pattern is duplication of bank accounts across multiple vendors that claim to be unrelated. Building a bipartite vendor-to-bank network surfaces hubs that your team can check against registration records. Tying bank accounts to device fingerprints of the submitter further reduces impersonation risk.
Signals and evidence:•
Edge clustering near thresholds: A bar dashboard that counts invoices in narrow bins below limits should be flat. Tall bars indicate split or staged invoices.•
Duplicate bank accounts: A vendor-to-bank network should look like a set of pairs. Shared bank hubs are prime audit targets.
2. Payroll and shift fraud
Buddy punching and location spoofing raise costs and create safety exposure because rosters misrepresent who is on site. The cleanest detector is a mismatch between badge events and geofence hits at the gate. Another detector is identical timestamp patterns that repeat across groups of employees. Linking time and attendance to device fingerprints stops account sharing and strengthens evidence. The goal is an auditable trail that stands up during disputes.
Signals and evidence:•
Badge without geofence: A table with employee, badge time, site, and geofence status should show positive hits for valid entries. "No" entries are high-priority reviews.•
Identical patterns across staff: A heatmap graph by employee and day should show natural variation. A bright column points to scripted submissions.
3. Safety integrity and certification governance
Safety data must reflect real inspections in real time. Large bursts of form submissions in a single minute, especially at the end of a shift, are inconsistent with field work. Certification tracking also matters because expired authorizations create legal exposure and can void insurance in the event of an incident. A modern system alerts well before expiry and prevents assignment of tasks to unqualified workers. Incidents across industrial supply chains show that when organizations must disconnect systems after a cyberattack, paper or offline safety controls need to remain available, so digital processes should always have evidence trails that can be audited later. aurubis.com
Signals and evidence:•
Burst submissions: A bar dashboard of submissions per minute should look like a series of small bars. A spike indicates backfilled paperwork.•
Expired certifications: A table of employee, certification, and days to expiry highlights negative values that require immediate action.
Why These Examples Matter for Miners
Industry incidents show that mining and metals are high-value targets. Norsk Hydro's LockerGoga event forced manual operations and large direct costs , which is the same pattern we try to prevent with identity hardening, device intelligence, and continuous trust. Aurubis had to disconnect systems across sites after a cyberattack , a reminder that containment and recovery benefit from signed firmware and clean configuration logs. The Transnet port disruption and the Colonial Pipeline shutdown both demonstrate the broader supply chain effects of cyberattacks, from logistics delays to fuel shortages . Rio Tinto's exposure through a third-party transfer tool reinforces the importance of vendor monitoring and data governance in addition to plant controls .
How CrossClassify Maps To This Hierarchy
CrossClassify turns the hierarchy into a working control system that protects people, production, and revenue. The platform unifies identity, device, and behavior into a single risk score that is evaluated continuously across OT and IT, not only at login. This continuous posture matters in mines where risk can jump during contractor VPN sessions, during PLC configuration windows, or during fuel and weighbridge events. Scores update as new evidence arrives from sensors, PLCs, mobile apps, payment systems, and access gateways. Actions are precise and timely, so good users move fast while risky sessions meet targeted challenges or are contained.
Device fingerprinting for mining contractors.
CrossClassify assigns durable device identities to rugged tablets, HMI workstations, surveyor laptops, and dispatch mobiles. The fingerprint resists cookie resets, private browsing, and NAT, which is common on site networks. It links accounts, payouts, holds, and refueling events back to the same hardware even when usernames change. This is the key to catching roaming credentials, shared admin passwords, and multi account abuse in procurement and inventory.
Behavioral biometrics for mining operators.
The platform models how genuine operators work in control rooms and how genuine drivers operate haul trucks. It learns keystroke timing, pointer paths, dwell time on SCADA screens, and navigation sequences through engineering tools. It also learns movement patterns from telematics such as speed envelopes, idle profiles, and stop sequences on specific routes. These models surface bots, imposters, GPS spoofing, and scripted safety submissions without constant friction.
Real time risk scoring for mining ICS.
CrossClassify correlates command mix, throughput, and configuration context to score PLC and SCADA activity as it happens. Elevated Write or Stop commands during production raise the score immediately. Protocol use on unexpected ports, unsigned firmware uploads, and historian polling spikes do the same. Scores drive automated actions such as session kill, command block, step up verification for an engineer, or change freeze until a supervisor approves.
Link analysis across vendors, bank accounts, users, and assets.
The platform builds networks that connect vendors to bank accounts, employees to inventory adjustments, RFIDs to refuels, and devices to accounts. These networks expose hubs that normal tables hide, for example a single bank account receiving payouts from several vendors or one device driving adjustments across many warehouses. Investigators get a visual network with click through to the underlying events.
Policy engine and actions that do not slow the mine.
When risk is low, CrossClassify stays silent. When risk rises, the system applies targeted friction such as one time MFA on a risky device, temporary hold on a refuel, supervisor approval for a PLC change, or supplier payout quarantine. Policies are site aware and shift aware, so allowances differ between maintenance windows and production windows. The objective is protection with minimal interruption.
Evidence packs for audit and recovery.
Every alert ships with explainable artifacts that match the hierarchy: heatmaps, line graphs, bar charts, tables, and network diagrams. These diagram, dashboard, table, graph, and network views make it simple to prove why a session was blocked, to challenge a charge, or to brief a regulator. Evidence is retained with version history so teams can compare before and after states for firmware, configurations, and environmental telemetry.
Built for mining data and environments.
CrossClassify integrates with OPC UA and Modbus collectors, historians such as PI and similar, SIEM and SOAR systems, IAM and VPN gateways, dispatch and fleet platforms, and ERP for procurement and payroll. Edge collectors cache during link outages and sync when connectivity returns, which is essential for remote pits and underground operations. Data minimization and tokenization options keep personal data scoped while preserving link analysis and device intelligence.
Examples that align to the hierarchy.
•
Account takeover signals are detected by combining device fingerprint, login geo and hour, and session behavior, then rendered as a site by hour heatmap with pass and fail interpretations.•
Unauthorized SCADA commands are scored using command mix baselines and production context, with a graph that shows Write and Stop spikes during active throughput.•
GPS and fuel custody are tied together so a refuel with impossible movement between pings triggers a hold and a supervisor check.•
Environmental telemetry near the legal limit is flagged by distribution models that reveal edge clustering and by tables that track rapid post capture edits.•
Vendor fraud is exposed by a vendor to bank account network that highlights duplicate payout targets across supposed suppliers.
For an overview of capabilities tailored to miners, visit the solution page.
For a deeper discussion of the threat landscape and controls, read this article.
For a deeper discussion of the threat landscape and controls, read this article.
Explore CrossClassify today
Detect and prevent fraud in real time
Protect your accounts with AI-driven security
Try CrossClassify for FREE—3 months
Share in
Frequently asked questions
Strong defense comes from combining device recognition with behavioral signals, then escalating only risky sessions. CrossClassify risk scores each session and requests MFA only when signals look abnormal, which protects production while preserving speed. Read more
Monitor new networks and session bursts from contractors and correlate with pending change windows. CrossClassify watches ASN and device fingerprints, then pauses risky sessions when they approach configuration endpoints. Learn how continuous monitoring closes gaps
Track command mix and overlay Run or Stop against throughput so unsafe commands appear immediately. CrossClassify's behavior models and policy engine can block or alert when write or stop commands spike during high output. Background reading
Shared credentials create blind spots and raise blast radius. CrossClassify fingerprints devices and builds graphs of credential to endpoint relationships, then flags hubs and enforces step up checks. See device intelligence fundamentals
Physics and distribution aware analytics expose clustering at the limit and fast post capture edits. CrossClassify correlates sensors, flags edge mode distributions, and produces evidence dashboards for auditors. Program design tips
Fuel custody aligns with engine hours and route geometry, therefore outliers are detectable. CrossClassify links vehicle identity, GPS, and fuel events, then alerts when volume does not match expected usage. Frameworks for continuous trust
Baseline the in minus out delta and the grade distribution, then watch for sustained positive deltas and new tails. CrossClassify builds rolling baselines and surfaces anomalies as graphs and tables that trigger review before shipment. See mining focused guidance
You need explainable artifacts that show patterns clearly using tables and graphs. CrossClassify preserves diagram, dashboard, table, graph, and network artifacts for each alert so finance and compliance can act with confidence. Why evidence matters in modern defense
Bots distort demand signals and overwhelm infrastructure, often hiding behind headless browsers. CrossClassify detects automation through device traits and behavior, then rate limits or blocks while keeping legitimate sessions fast. Deeper look at gaps in traditional tools
Yes, behavioral models can be tuned to site context and hardware to learn genuine operator rhythms. CrossClassify adapts models per site and device type to keep false positives low in challenging environments. Intro to behavioral signals
Network relationships between vendors and payout accounts reveal hidden hubs. CrossClassify's link analysis produces a vendor to bank account network that highlights duplicates instantly. Practical patterns and controls
Look for missing geofence confirmations and identical time spikes across employees and days. CrossClassify correlates badge events, geofences, and time series to flag synchronized patterns with clear heatmap evidence. Site level perspective
Let's Get Started
Discover how to secure your app against fraud using CrossClassify
No credit card required
